The Power Behind Power BI: Is It Right for You and Your Organization?

By Mariyah Saifuddin

I’m approached frequently by women across all industries and job titles for my take on how companies can best wrangle the beast that is data and analytics. Cloud computing? Dashboards? Forecasting tools? Self-serve vs. data professionals? 

Power BI, a Microsoft product that finds insights within a business’ data, is just one tool in the arsenal of great data analytics tools out there today. But it distinguishes itself by being accessible to people with vastly different levels of analytics knowledge. As part of enterprise subscriptions of Microsoft Office 365, it also becomes a natural tool for organizations to use.

So when presenting recently to a room of managers who were invested in their organizations’ data needs I chose to highlight some of the ways Power BI can be an asset to them. 

It was the annual conference of the Great Lakes Women’s Business Council, which celebrated 40 years this year. The conference in Novi, Michigan, incorporates educational breakout sessions for not only business owners but also for corporate partners committed to developing a diverse supplier chain. My breakout session was a 90-minute deep dive into the Power of BI.

The focus of the session was looking at data and analytics reporting through a business lens. 

An audience with diverse needs

With an informal poll, it became evident that the almost 50 attendees’ knowledge and experience varied depending on their organizations:

  • Half of the room identified as part of the automotive supply chain while the other half did not.
  • Half of the attendees were familiar with Microsoft Power BI as an analytics reporting tool and the other half were not.
  • A handful of attendees had an IT support team that cleansed and connected data and generated the dashboards and reports they needed for their stakeholders.
  • A handful of attendees were connecting multiple Excel files to create a flat file they used to get the reporting numbers required by their stakeholders.

Who are the stakeholders?

Where to begin with such a varied level of experiences and operating styles?

It really does begin with the basics, which is where we always start at Innovative Solution Partners. By connecting the dots between people, operations and technology, we develop customized reporting solutions that optimize time and effort. So that’s where we started in presenting Power BI — and the power behind presenting data in a way that brings understanding and allows for action.

First question: Who are your stakeholders, and what do they want to know from you? 

Stakeholders can come from various areas of the business; they understand the business and recognize the project’s significance in shaping the company’s future. 

Incorporating stakeholders from various business units and roles ensures clear understanding of the organization’s requirements and challenges. 

For data analytics projects, it is important to consider involving stakeholders from departments like sales, finance, operations, and customer service. This diverse representation helps capture different perspectives, identify relevant data sources, and align analytics solutions with specific business processes.

Depending on the purpose of your analytics reporting, stakeholders can even include those external to your business. In this instance, stakeholders included clients who wanted to understand how the manager’s organization was sourcing for their business. Remember to think about what information you have access to and how you can leverage it to share valuable information with all of your stakeholders.

How Power BI can empower teams

The audience engaged and discussed as I walked through a customized Power BI report developed by the Innovative Solution Partners team.  

The report that I and our team created for the session focused on supplier diversity metrics that were defined by the supplier diversity professionals designing the curriculum for the event. What began as a simple ask for a Power BI overview for their colleagues ended up in interviews and discussions which resulted in the Innovative Solution Partners team unpacking the intricacies of their work and the number of stakeholders they report to internally and externally. Ultimately, they realized  what metrics matter most to them.

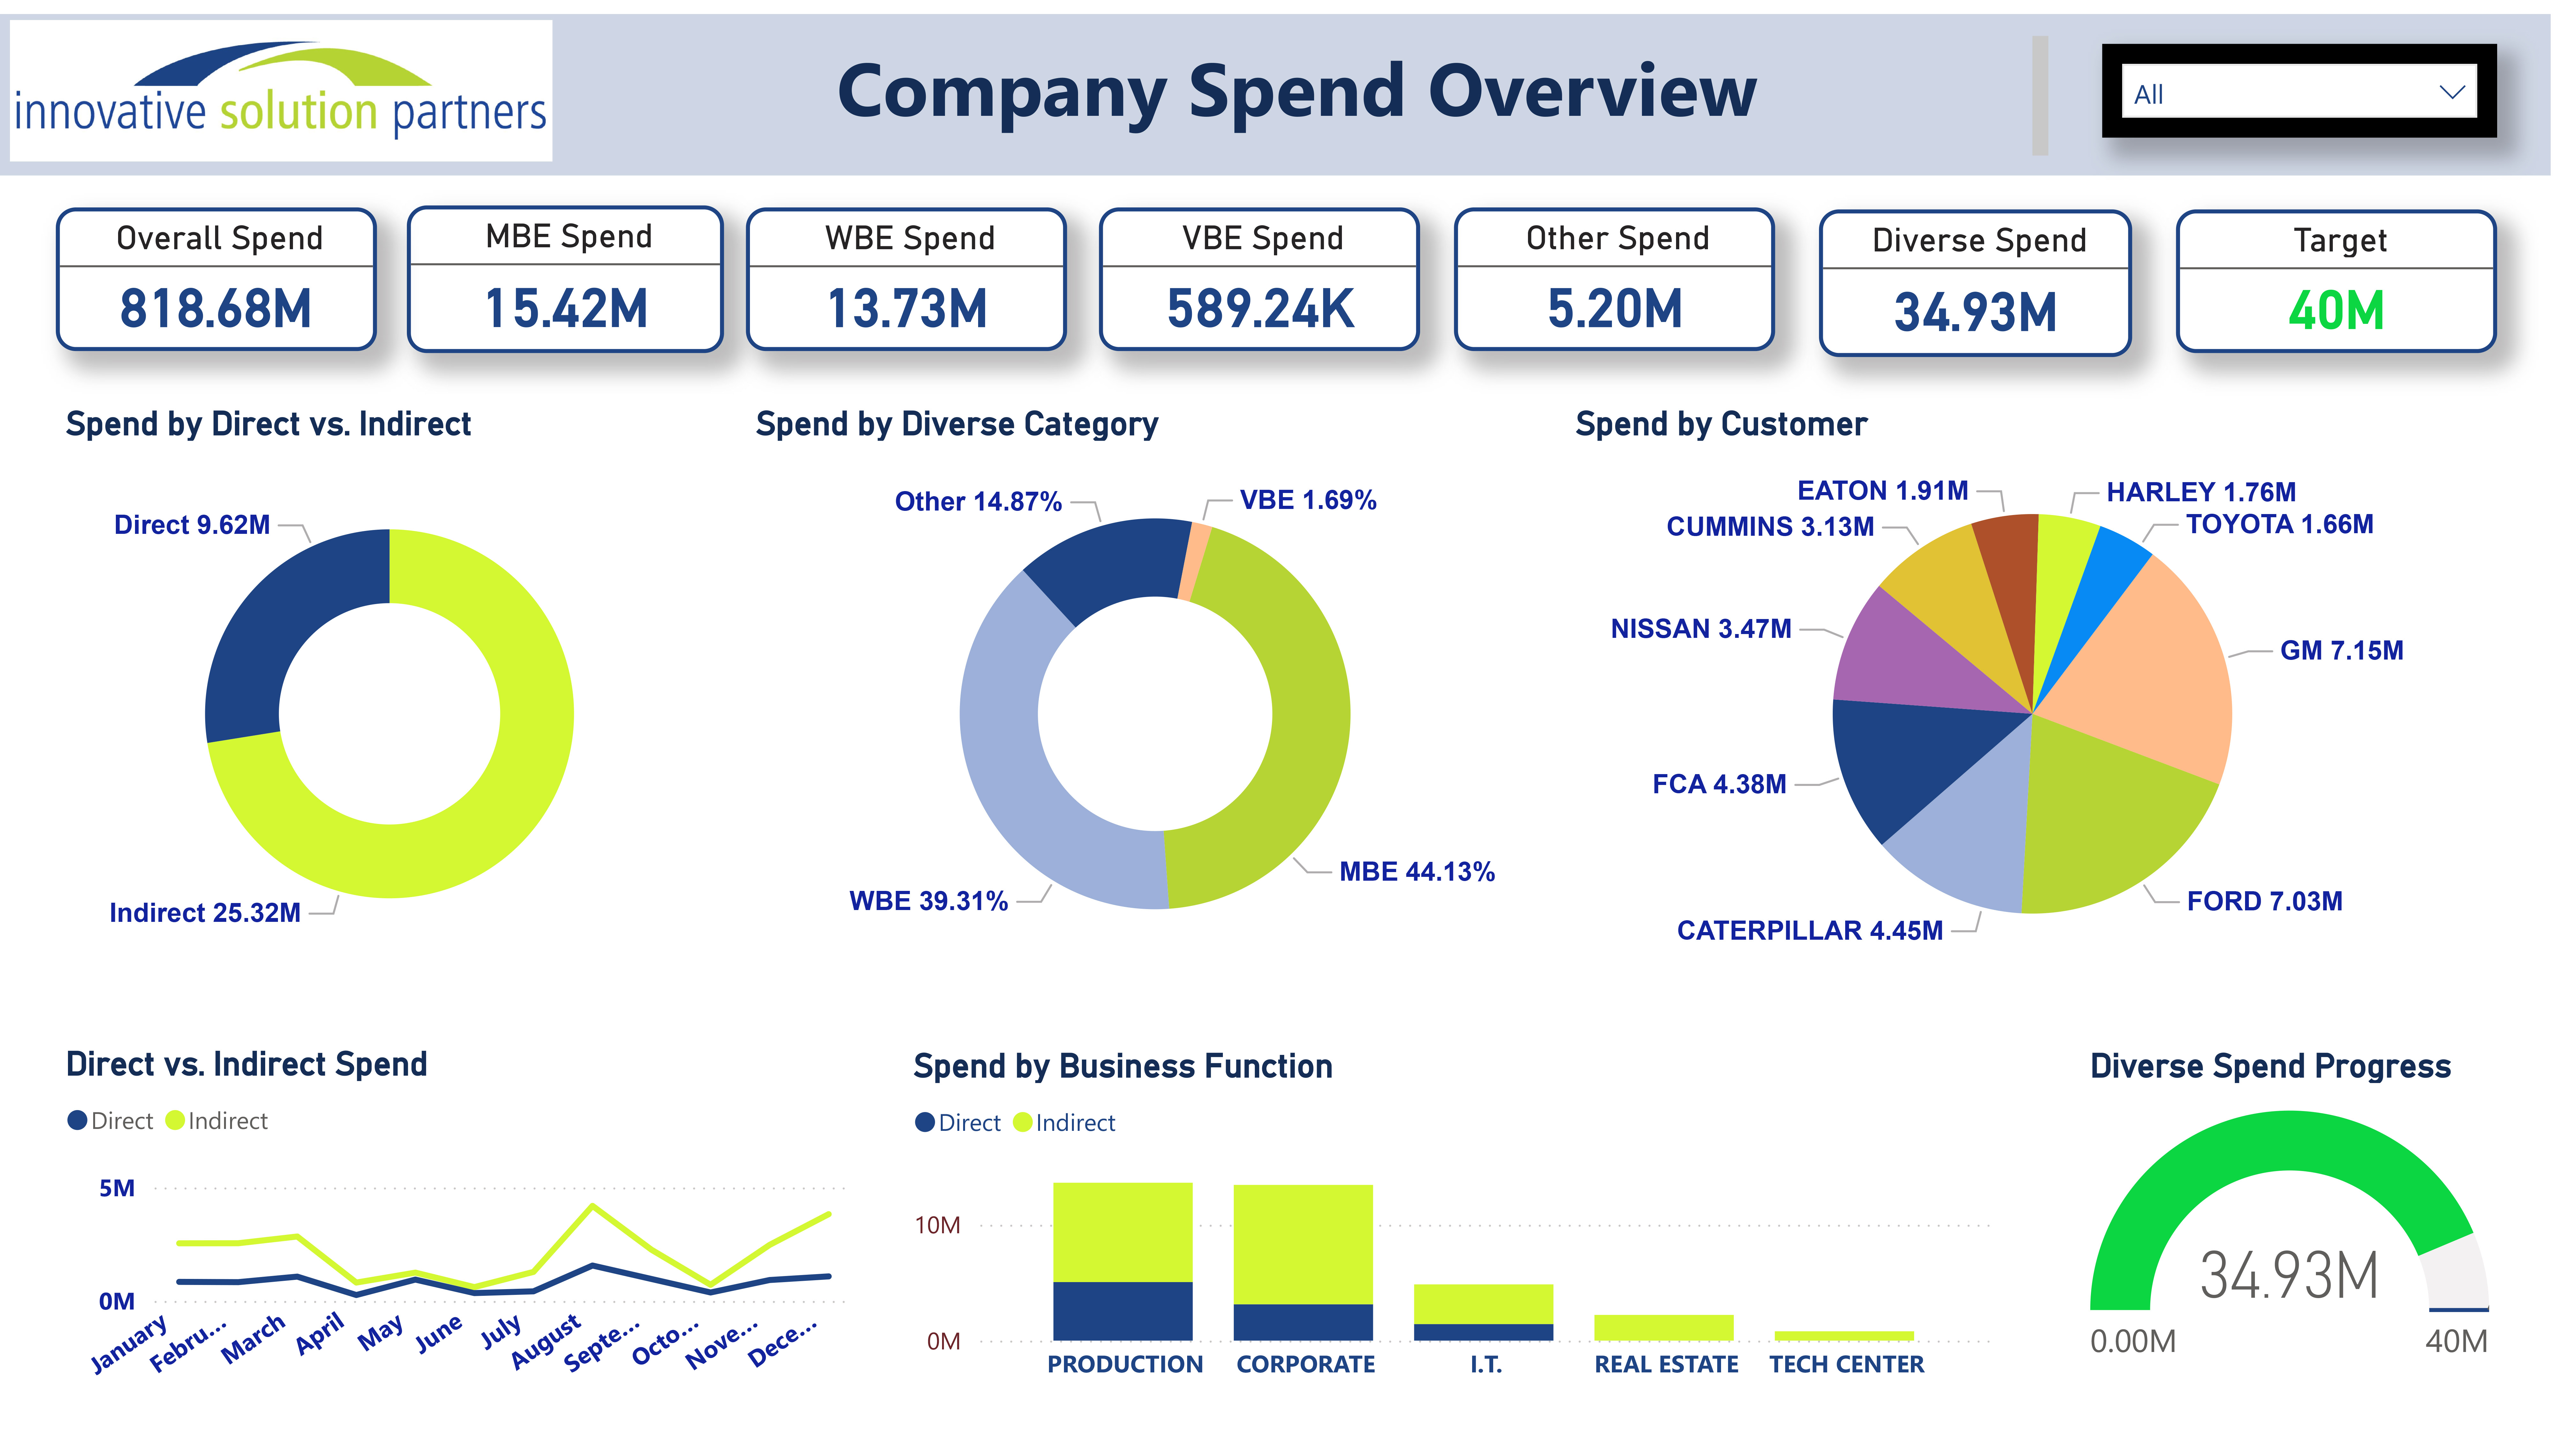
We followed our F.O.C.U.S. methodology to create the report that you see below.

power bi dashboard

We began with finding out the participants’ requirements by asking questions about what information they need to share with whom.  Then we dug deeper to learn what they would really want to see if they had a magic wand. 

The ability to see how data was currently being shared in supplier reporting portals allowed for us to better design a report that would work for them. All in all, it was about listening, learning, and reflecting to decide a design that would work best for them.

Power BI can then be used to identify trends, uncover disparities, and measure progress towards goals. Automating data collection and analysis can significantly reduce the time and effort required for reporting.


It is all about connecting people, operations, and technology, and when this focus is kept, it is possible to streamline reporting workflows and improve efficiency.

Where to go from here

As you start your own Power BI project, looking at how things are done today is a valuable place to start from. It allows you to understand how your users interact with the system while actively listening to what they like and do not like. Their aspirations are what often start the final designing process.

Then think about what you would love to see if anything was possible. This allows for brainstorming and thinking “out of the box.” Finally think about why you would want to see that information. The “why” will make you and your team get clear on what your final design must include. At the end of the day, a clean set of visuals in your report can be more powerful than a report full of confusing KPIs and metrics.

The interactive session that day allowed for colleagues to share best practices, learn from one another, and expand their own networks of connections. The sharing allowed them to recognize little movements or shifts in their own operations that would result in improving of processes in their own departments.

Analytics reporting is a journey on which you will make some twists and turns. Don’t be surprised by having to re-evaluate your design based on what you learn while working on a solution. The beauty of tools like Power BI is the ability of users to create their own visualizations without effecting any of the underlying data.

Attendees at the session shared their experiences with manual reporting, multiple spreadsheets, and limited IT support — and these were not new scenarios to me. What did occur to me was how diverse the experiences were — from those who had whole teams working to streamline reports and data to those who had no help and were looking for ways to start this process.

Attendees left the session feeling empowered and with an enhanced way of approaching their methods of sharing information with their stakeholders. Whether they may be taking a self-service approach or working with IT teams, participants gained a deeper appreciation for the potential of data visualization in understanding supplier diversity performance. The session sparked ideas for making small but impactful changes to enhance their data tracking and reporting processes.

By providing a platform for knowledge sharing, collaboration, and inspiration, the session empowered supplier diversity professionals to enhance their data tracking and reporting capabilities. 

As one attendee shared: “Your insights were incredibly valuable and thought provoking, and the way you broke down the information made it both engaging and easy to understand. It has certainly inspired me to think how can I take my organization’s data to the next level.”

Resources for using Power BI

While Power BI can be employed by individuals or IT teams its power can be amplified in the right hands with auxiliary data teams with expertise in its use. 

At Innovative Solution Partners, our Power BI expertise has helped organizations large and small to take control of their data and use it for making strategic decisions. 

Some additional resources include: 

Power BI overview

Power BI for personal use

Create and use Power BI for analytical reports

If you’d like more insights into using Power BI, feel free to schedule a consultation with our team.