How to Choose the Right Cloud Analytics Tool

By Mariyah Saifuddin

SAP Analytics Cloud is one of many viable cloud-based analytics tools available to enterprises. But what do you need to think about before finalizing what tool to move forward with?

We talked with Hau Ngo, a SAC expert on this topic in our most recent podcast. Ngo’s advice? Start by looking at your system landscape from a data source point of view. 

According to Ngo, SAP does a very good job of marketing their tools in terms of features and benefits from a dashboarding perspective, but SAP has such a large product matrix that it is hard to say, “does this feature work in one instance versus another.”

Planning tips

  1. SAC provides different functionality depending on the back end
  2. SAC can mask the source of data from users to make it a seamless event for users. For instance, SAC can consume data from a data warehouse or a transactional system.
  3. SAC works best with a proper data warehouse. But if you happen to have a S/4HANA system, you can directly connect your dashboarding tool. SAP is making this process easier as time passes.
  4. If your source system is a SAP system, strongly consider SAC because of integration with live data connections and security as you will inherit the security profiles of your source system. This takes advantage of single sign-on and reducing maintenance of systems. Ngo dives into this further in the podcast.

Designing tips


Bar chart

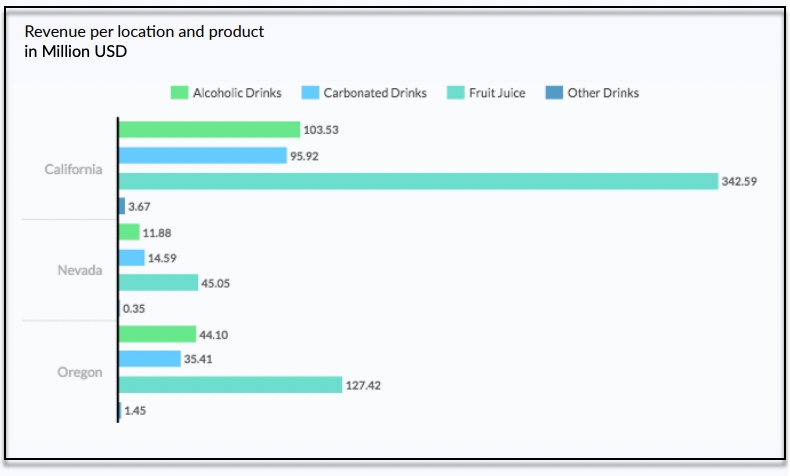
SAP Analytics Cloud offers several different chart visualizations that are primarily categorized by function. For example, a designer can use bar charts for comparisons or a set of line graphs for trends.

Although SAC provides a multitude of visualization options, it is important to stick with what works best for the users. For instance, bar charts and tables are easier for users to understand than scatter plots if they are not used to working with such chart types.

 In Ngo’s experience, the top three chart types are bar, numeric, and table. These three options are a great place to start building from as many users are used to generating their existing dashboards from tools like Microsoft Excel and carry this over into using SAC as a self-service tool.

Leveraging self-service capability of SAC

From a personnel perspective, find someone who is excited about dashboard and what the tool can do for your organization. This person should really be able to think about how it helps a user in their day-to-day operations. 

For instance, if field staff could open up their mobile or tablet to get sales history before a meeting; or business analysts get a full-color PDF with information they need that simplifies their role.

No matter what route you take, it is important to look at the overall cost of ownership for the cloud-based analytics tool. Customers with non-SAP systems in the mix can be tempted to choose other tools because they have similar features at a lower cost. But that cost saving is usually offset by higher development times or maintenance costs. 

The bottom line: You may save in costs but pay in other ways. 

There is an expectation today of speed, and app development and dashboard development are much faster than they ever have been. If your tool delivers efficiently and effectively to your customer base, then you are golden, says Ngo. 

If, however, it takes three months to get a lower cost tool up and running, that might be a deal breaker for your community.

In the end, there is no right solution when choosing a cloud-based analytics tool. You must take the time to evaluate the needs of your organization and be aware of the total cost of ownership.

Interested in more Tech-Driven Business podcasts? You can listen here

Other parts in this SAC series, all available on the Tech-Driven Business podcast page:

Additional resources

Recent Posts
Media Inquiries

Contact:
Mariyah Saifuddin

Email: info@isolutionpartners.com